Interactive UI
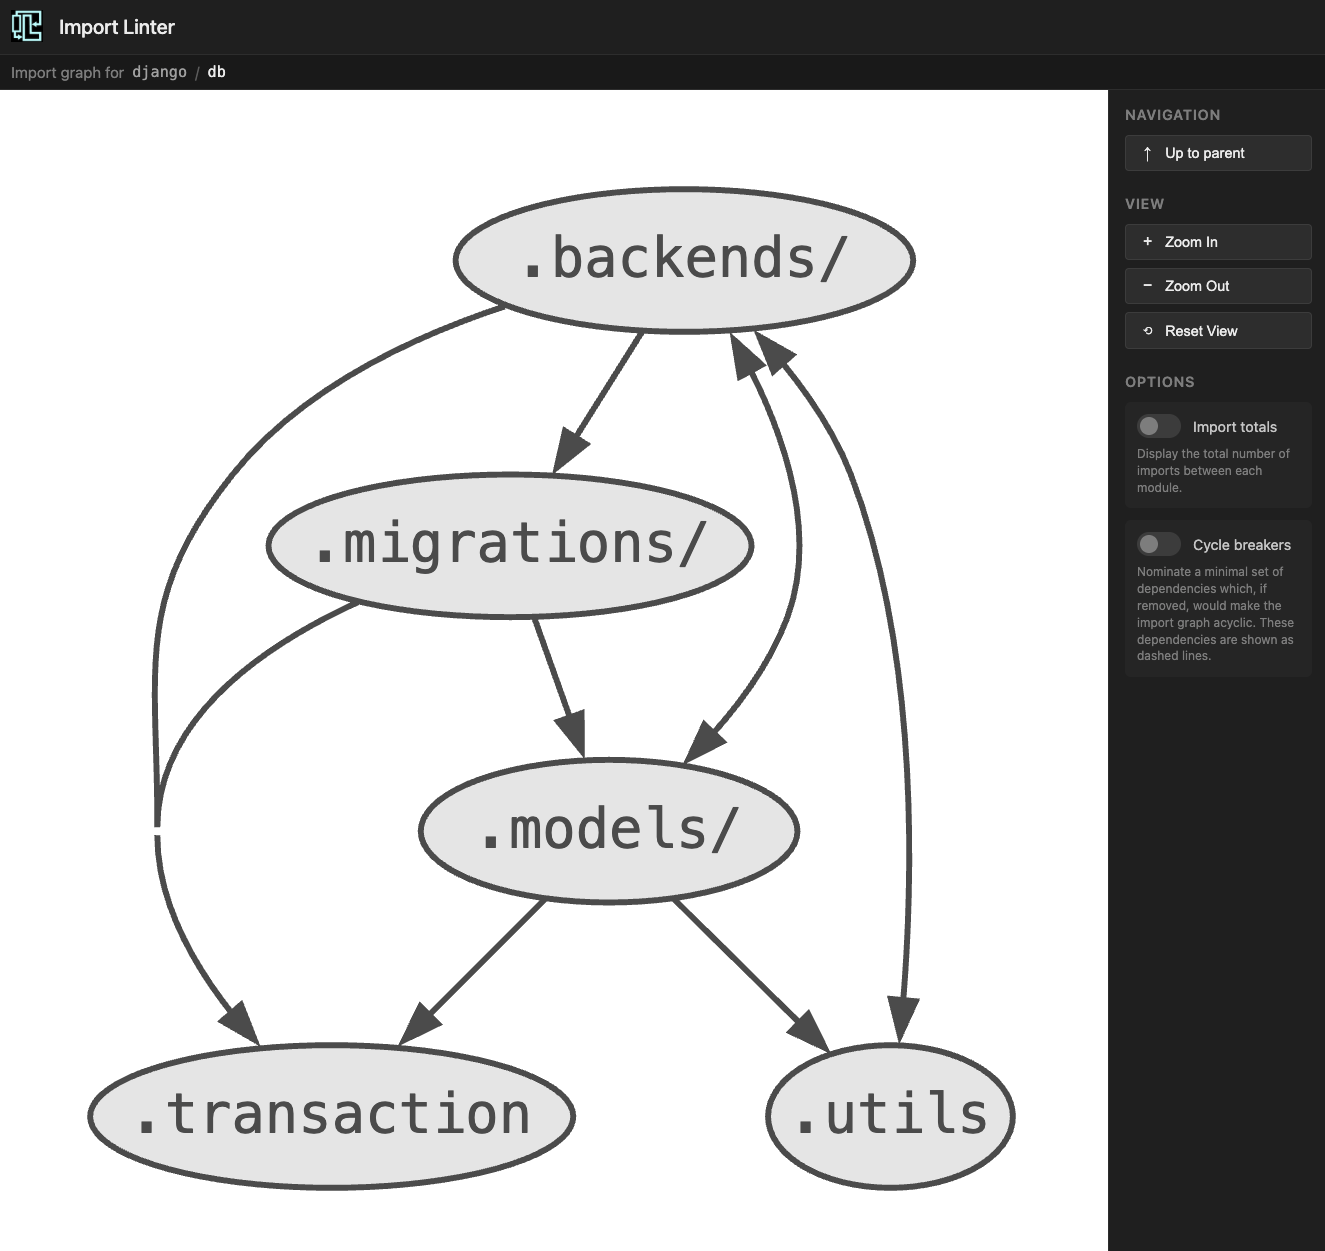
Import Linter provides a local browser-based interface that you can use to explore the architecture
of any installed Python package. This is what it looks like when visualizing the django.db package:
Launching the UI
Don't forget to install ui dependencies
The interactive UI requires extra dependencies to be installed.
Run import-linter explore, passing the name of the module you want to explore:
import-linter explore mypackage
This will start a local web server and open your browser. The module must be importable from the current directory.
You can also pass a subpackage to start deeper in the hierarchy:
import-linter explore mypackage.subpackage
Navigating the graph
The graph shows the dependencies between all the immediate children of the package you're viewing.
An arrow can be read as saying "depends on". If package one points to two, then at least one module in one imports a module in b.
Example
In the example above, there is an arrow from .models to .utils. This is because (along with one other import)
django.db.models.constraints imports django.db.utils.DEFAULT_DB_ALIAS.
Drilling down
Click on any package node in the graph to drill down into it and see its children. Only packages (modules that contain submodules) are clickable.
Options
The right sidebar provides options to customize the visualization.
Import totals
Enabling Import totals labels each arrow with the total number of individual import statements it represents.
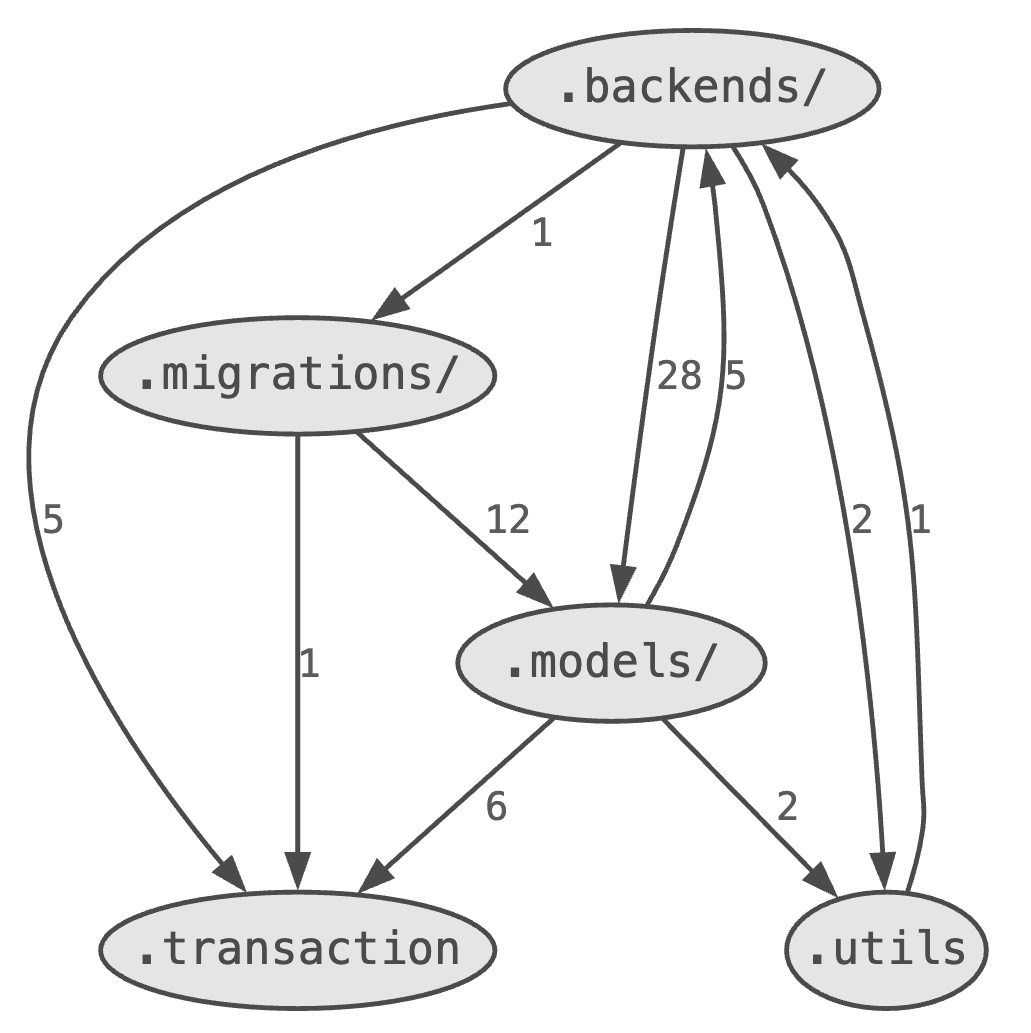
Here you can see that there are two imports from modules within .models of modules within .utils.
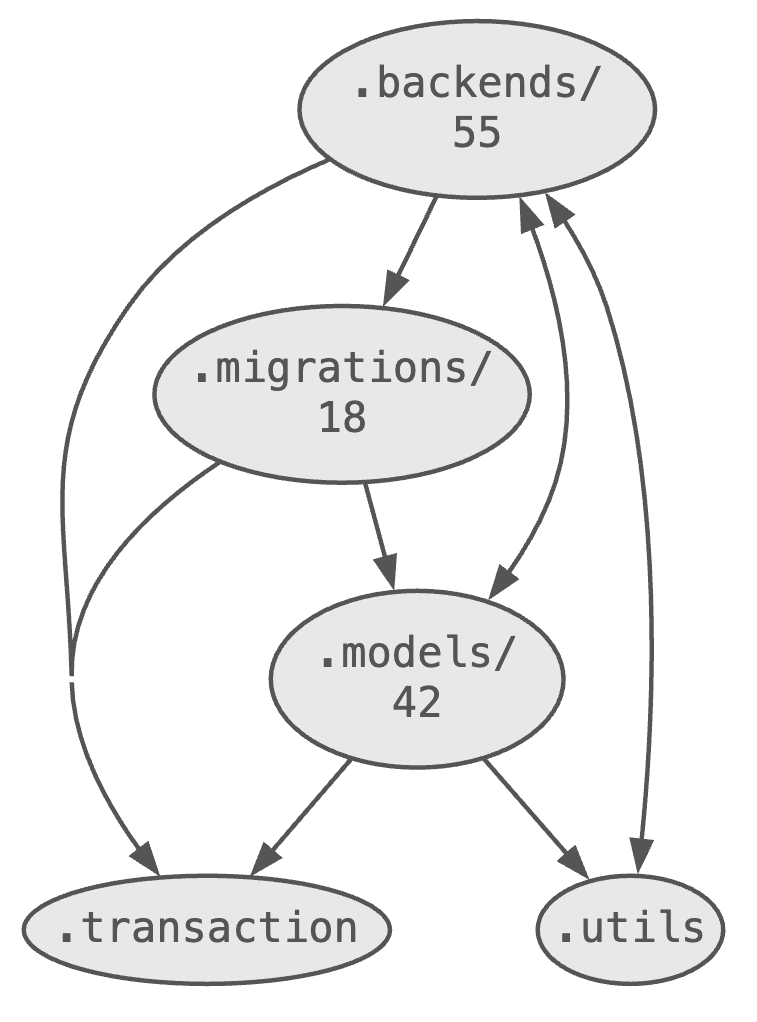
Module counts
Enabling Module counts labels each package node with the number of modules it contains (i.e. its descendants in the module tree).
Cycle breakers
Enabling Cycle breakers highlights (with a dashed line) a minimal set of dependencies that, if removed, would make the graph acyclic.
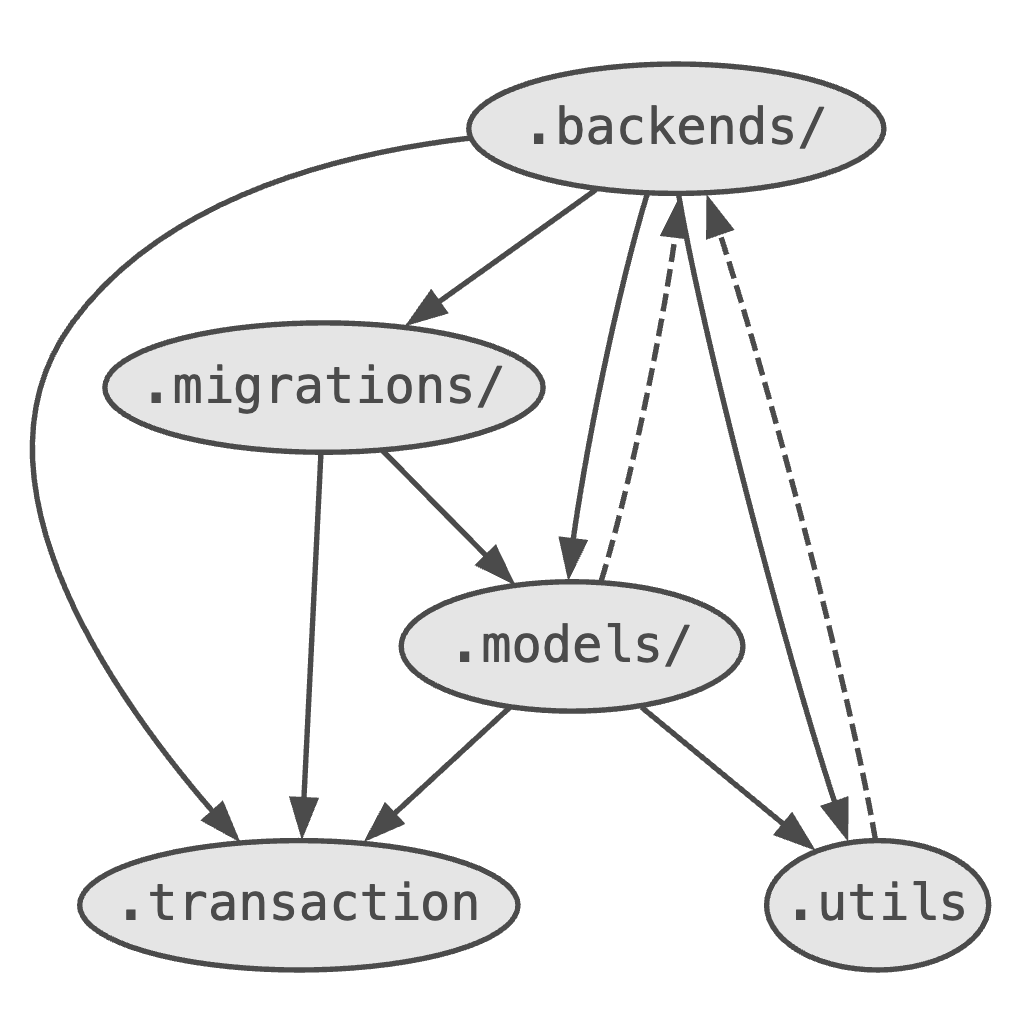
Here you can see that two of the dependencies are shown as a dashed line. If these dependencies were to be removed, the graph would be acyclic. To decide on the cycle breakers, Import Linter uses the nominate_cycle_breakers method provided by Grimp.
Drawing graphs on the command line
If you'd prefer to get the raw graph data rather than using the interactive UI,
you can use import-linter drawgraph to output a graph in
DOT format to stdout:
import-linter drawgraph mypackage
This can be piped to Graphviz or any other tool that accepts DOT input:
import-linter drawgraph mypackage | dot -Tpng -o graph.png
The same display options are available as flags:
import-linter drawgraph mypackage --show-import-totals
import-linter drawgraph mypackage --show-module-counts
import-linter drawgraph mypackage --show-cycle-breakers